Showing posts with label Global. Show all posts

Global Flu Surveillance Updates


image


# 6708


After an uncommonly subdued 2011-2012 influenza season (see CDC: The Close Of A Mild Season), and a summer that featured an unprecedented number of variant swine flu infections (see An Increasingly Complex Flu Field) in the United States, no one is quite sure what to expect with the coming flu season.


Invariably, the word most often used by researchers when describing influenza is `unpredictable’.


Nevertheless, in order to come up with a vaccine each year, scientists must decide – 6 months in advance – what flu strains they think will be most active in the season ahead.


After 3 years with essentially no changes, this year’s flu vaccine formulation makes alterations to both the H3N2 and B virus strains.


  • The H1N1 component remains essentially unchanged, with the A/California/7/2009 (H1N1)pdm09-like  still recommended.
  • The old A/Perth/16/2009 (H3N2)-like virus now gives way to the A/Victoria/361/2011 (H3N2)-like virus.
  • And the Victoria lineage B/Brisbane/60/2008-like virus will be replaced by a Yamagata strain; the B/Wisconsin/1/2010-like virus. 


The addition of these two new strains makes getting the vaccine this year all the more important, as community immunity to these recently emerging strains is likely low.


The vaccine die having been cast, each fall we monitor influenza activity around the world via a number of reporting tools, including:


There others, of course.


Hong Kong’s CHP  produces an excellent Weekly Flu Express, and when it’s summer in the Northern Hemisphere we keep a close watch on the Australian  and New Zealand influenza surveillance sites.


Combined, these resources provide us with a pretty good - albeit `backwards looking’ - overview of flu activity. At least in North America, Europe, and parts of the Pacific Rim.


Note: There are plenty of areas around the world where surveillance and reporting are lacking, and so we still run the risk of being blindsided by an emerging influenza strain. 


During flu season I try to provide links, and highlights, to many of these flu surveillance reports each week. For now, flu activity around the world is low, but there are signs it may be increasing. 


From yesterday’s WHO Flu report:


Summary

• Many countries of the Northern Hemisphere temperate region reported increasing detections of influenza viruses, particularly in North America and Western Europe, however none have crossed their seasonal threshold for ILI/ARI consultation rates.
• Several countries in the tropical areas experienced active transmission of influenza virus in recent weeks. In the Americas, Nicaragua and Costa Rica reported mainly influenza B virus detections. In Asia, India, Sri Lanka, Nepal, and Cambodia are all reporting a mixture of all three virus subtypes.
• In Sub-Saharan Africa, Cameroon and Ethiopia have reported an increase in influenza virus detections.
• Influenza activity in the temperate countries of the Southern Hemisphere is at inter-seasonal levels. A review of the 2012 southern hemisphere influenza season was published in the Weekly Epidemiological Record (WER) 2 November 2012, vol. 87, 44 (pp. 421–436)


The ECDC’s latest WISO Report finds very little flu activity across Europe.


Weekly reporting on influenza surveillance for the 2012–13 season started in week 40/2012 in Europe.


•  In week 44/2012, all 26 reporting countries experienced low intensity of clinical influenza activity.
•  Of 279 sentinel specimens tested across 19 countries, only two were positive for influenza virus.
•  No hospitalised laboratory-confirmed influenza cases were reported.


Five weeks into the surveillance season for influenza, there has been no evidence of sustained influenza virus transmission in EU/EEA countries.


The story is pretty much the same in Canada, as we learn from their latest FluWatch Report.


Overall Influenza Summary

  • Influenza activity in Canada increased slightly compared to the previous week; however overall activity still remains fairly low, with most regions of the country reporting no activity.
  • In week 44, a total of 64 laboratory detections of influenza were reported; of which 91% were for influenza A viruses [71% A(H3) and 29% A(un-subtyped)].
  • Six influenza outbreaks in long-term care facilities were reported in week 44.
  • Eleven influenza A-associated hospitalizations were reported in week 44: 8 in adults >20 years of age, and 2 in children.
  • The ILI consultation rate increased in week 44 to 21.9 per 1,000 patient visits but is within the expected level for this time of year. image


In the United States, the CDC’s FluView Reports the beginnings of limited flu activity around the country:

012-2013 Influenza Season Week 44 ending November 3, 2012


image


Synopsis:

During week 44 (October 28-November 3, 2012), influenza activity increased in some areas, but overall was similar to activity last week in the United States.

  • Viral Surveillance: Of 3,277 specimens tested and reported by U.S. World Health Organization (WHO) and National Respiratory and Enteric Virus Surveillance System (NREVSS) collaborating laboratories during week 44, 227 (6.9%) were positive for influenza.
  • Pneumonia and Influenza Mortality: The proportion of deaths attributed to pneumonia and influenza (P&I) was slightly above the epidemic threshold.
  • Influenza-associated Pediatric Deaths: No influenza-associated pediatric deaths were reported.
  • Outpatient Illness Surveillance: The proportion of outpatient visits for influenza-like illness (ILI) was 1.3%, which is below the national baseline of 2.2%. All 10 regions reported ILI below region-specific baseline levels. One state experienced low ILI activity; New York City and 49 states experienced minimal ILI activity, and the District of Columbia had insufficient data.
  • Geographic Spread of Influenza: The geographic spread of influenza in 1 state was reported as regional; 8 states reported local activity; the District of Columbia and 33 states reported sporadic activity; Guam and 8 states reported no influenza activity, and Puerto Rico and the U.S. Virgin Islands did not report.


Many years, influenza doesn’t begin to really spread until December or even January, so the level of activity we are seeing today is probably a poor prognosticator of what we will be seeing two or three months from now.


Influenza, however, is notoriously unpredictable. Which makes each flu season unique, and worthy of our attention.


Stay tuned.

»» Read More

WHO: 2012 World Health Statistics Report


image

# 6329


The World Health Organization has released the 2012 edition of their World Health Statistics report, an annual compilation of health-related data from its 194 Member States. This report also summarizes progress being made in achieving the health-related Millennium Development Goals (MDGs).


While infectious diseases get most of the world’s attention, it continues to be the NCDs (Non-Communicable Diseases) - like high blood pressure, heart disease , diabetes, and tobacco related illnesses – that exact the greatest toll on human health.


Some excerpts from today’s press release highlights these findings:


New data highlight increases in hypertension, diabetes incidence

News release

16 May 2012 | Geneva - The World health statistics 2012 report, released today, puts the spotlight on the growing problem of the noncommunicable diseases burden.


One in three adults worldwide, according to the report, has raised blood pressure – a condition that causes around half of all deaths from stroke and heart disease. One in 10 adults has diabetes.


“This report is further evidence of the dramatic increase in the conditions that trigger heart disease and other chronic illnesses, particularly in low- and middle-income countries,” says Dr Margaret Chan, Director-General of WHO. “In some African countries, as much as half the adult population has high blood pressure.”

<SNIP>

Published annually by WHO, the World health statistics is the most comprehensive publication of health-related global statistics available. It contains data from 194 countries on a range of mortality, disease and health system indicators including life expectancy, illnesses and deaths from a range of diseases, health services and treatments, financial investment in health, as well as risk factors and behaviours that affect health.

Some key trends in this year’s report are:

  • Maternal mortality: In 20 years, the number of maternal deaths has decreased from more than 540 000 deaths in 1990 to less than 290 000 in 2010 – a decline of 47%. One third of these maternal deaths occur in just two countries – India with 20% of the global total and Nigeria with 14%.
  • 10 year trends for causes of child death: Data from the years 2000 to 2010 show how public health advancements have helped save children’s lives in the past decade. The world has made significant progress, having reduced the number of child deaths from almost 10 million children aged less than 5 years in 2000 to 7.6 million annual deaths in 2010. Declines in numbers of deaths from diarrhoeal disease and measles have been particularly striking.


(Continue . . . )


DOWNLOAD THE SUMMARY BROCHURE

Available in 3 languages

DOWNLOAD THE FULL REPORT
Available in 3 languages


Of considerable interest to those of us who follow disease outbreaks around the world is the lack of disease and mortality information available from many low-resource countries.


Among low income countries, only about 1% of deaths (and their causes) are recorded, while just 34 countries – representing 15% of the world’s population – produce high quality cause-of-death documentation.


The two most populous countries in the world – India and China – do not have national civil registration systems in place, and instead generate estimates of births and deaths based on smaller population samples.


image


All of which helps to explain why, nearly two years after the end of the 2009 H1N1 pandemic, we still don’t have a good handle on how many people died from the virus.


This lack of surveillance and reporting extends far beyond just births and deaths, which is why there is so much ambiguity regarding the true prevalence of many diseases (including H5N1) around the world.


Much of the data that is available can be accessed via the WHO’s Global Health Observatory, which allows tailored online searches for health information by country or region.


Global Health Observatory (GHO)

»» Read More

Japan: Quake/Tsunami Risks Greater Than Previously Thought


image

Credit Wikipedia


# 6255


We’ve two seismic studies announced today in Japan - one regarding Tokyo’s vulnerability to a major earthquake and the other on the tsunami risk that would result from an offshore earthquake in the Nankai Trough.


Both substantially escalate the amount of damage that could be expected over previous estimates.


First stop, the Nankai quake scenario, as reported by the Japan Times.


20-meter tsunami projected from Honshu to Kyushu

Nankai quake scenario menaces Pacific coast

Kyodo

Wide swaths of the Pacific coastline stretching from Honshu to Kyushu may be hit by tsunami over 20 meters high if a newly feared megaquake occurs in the Nankai Trough, a Cabinet Office panel warned Saturday.

(Continue . . . )


Kuroshio, Kochi Prefecture could see a tsunami up to 34.4 meters (112 feet, or as high as a 10 story building), while parts of Shizuoka, Kochi and Miyazaki prefectures could see tidal waves of 10 to 20 meters.


Such an earthquake could send tsunami waves towards other Pacific shorelines, as well.


The second announcement comes from Japan’s Ministry of Education, Culture, Sports, Science and Technology (MEXT) which has determined that the fault line lying under Tokyo is shallower than previously thought, and capable of producing more damage than had been earlier estimated.


This report from Reuters:


Major quake impact on Tokyo could be worse than thought-study

31 Mar 2012 09:10

Source: reuters // Reuters

TOKYO, March 31 (Reuters) - The impact on Tokyo from a major quake could be much more devastating than the government has predicted, a new study shows.


The study by the Ministry of Education, Culture, Sports, Science and Technology comes just over a year after one of the biggest tremors on record struck Japan'se northeast coast, triggering a massive tsunami and the world's worst nuclear crisis in 25 years.

(Continue . . .)


You may recall that a couple of months ago (see Academics Debate Odds Of Tokyo Earthquake) we saw a report indicating that some scientists believe that the odds of a major earthquake striking Tokyo (previously estimated at 70% within 30 years) are overly optimistic, and that there is a 70% chance of a major Tokyo quake in the next four years.


And last year, in Divining Japan’s Seismic Future, I wrote about the most widely anticipated seismic event for Japan - the Tokai Earthquake – expected to be an 8+ magnitude, and forecast to occur between the Bay of Suruga and Cape Omasezaki in Shizuoka Prefecture sometime in the near future.


image


Major earthquakes have occurred in this region every 100-150 years, with the most recent recorded in 1498, 1605, 1707 and 1854.


That puts the Tokai region 157 years since their last major quake, and in the estimation of Dr Kiyoo Mogi – Japan’s leading seismologist – well overdue for another.   In 1969, Dr Mogi began warning that the Tokai area was particularly vulnerable, and today the area is monitored continually by the JMA.


Which is why the Prime Minister of Japan called upon Chubu Electric to shut down its No. 4 and No. 5 reactors at the Hamaoka nuclear plant last May, located roughly 200 km south-west of Tokyo.


While all of this is of greatest concern to those living in Japan, a major earthquake in one of the great cities of the world would not only be a horrendous human tragedy, it could cause economic repercussions around the globe.


In two blogs from last year we looked at the possible ripple effects of `Global Shocks’.


Last December in DFID: World Unprepared For Future Shocks  the UK’s DFID (Department for International Development) warned that with global economies in turmoil, and recessionary fears continuing to spread, finding money for many relief, humanitarian, or other worthwhile projects becomes more difficult.


And last July, in (OECD Report: Future Global Shocks), where we looked at a 139 page report  released by the OECD (The Organisation for Economic Co-operation and Development) that warned - as the world becomes more interconnected and interdependent - that `Global Shocks’ to the world economy become more likely.


In the report, they define a Global Shock as: a rapid onset event with severely disruptive consequences covering at least two continents.

image

They write:

Extremely disruptive events, such as earthquakes, volcanoes, financial crises and political revolutions destabilize critical systems of supply, producing economic spillovers that reach far beyond
their geographical point of origin.


While such extreme events have been relatively rare in the past, they seem poised to occur with greater frequency in the future. Global interconnections accompanying economic integration enable some risks to propagate rapidly around the world.


The bottom line here is that the world is now so interconnected – that while most disasters are localized - their economic and societal impacts can be felt thousands of miles away and can persist for months.


Of course Japan doesn’t have the market cornered when it comes to disasters; the United States, Europe, and the rest of the world are all capable of producing equally disruptive global shocks.  


Ultimately, a nation’s resilience in the face of a major crisis –whether it be local or global - comes from the bottom up, not from the top down.


Which is why agencies, like the ones below, urge greater individual, family, and community preparedness.


FEMA http://www.fema.gov/index.shtm

READY.GOV http://www.ready.gov/

AMERICAN RED CROSS http://www.redcross.org/


A few of my preparedness blogs from the past include:


When 72 Hours Isn’t Enough

Planning To Survive

An Appropriate Level Of Preparedness

In An Emergency, Who Has Your Back?

The Gift Of Preparedness: 2011

»» Read More

DFID: World Unprepared For Future Shocks


# 6040


The DFID (Department for International Development) – which is a UK government agency that manages aid to developing countries – issued a warning yesterday that the world is `dangerously unprepared’ to deal with future shocks.


International Development Secretary Andrew Mitchell warns that while a system is in place to provide humanitarian relief after disasters (UN’s Central Emergency Response Fund CERF), too few countries and agencies are fully funding it.


First their press release, then I’ll return with more.


World 'dangerously unprepared' for future shocks

27 December 2011

Some of the world's richest countries are failing to help prepare for large-scale disasters, such as earthquakes, floods and wars, despite clear evidence that the number of catastrophes is likely to increase in the years ahead, International Development Secretary Andrew Mitchell warned today.


Despite a year of unprecedented disasters – including famine in the Horn of Africa, the Japan tsunami, New Zealand earthquake, floods in Pakistan and most recently the Philippines – the United Nations’ international disaster response funding system is expected to be left severely underfunded.


The system – set up following the 2004 Boxing Day Tsunami – is designed to bring different countries funding into one single pot that makes the international response faster and more effective.


Experts believe that a sufficiently supported, single approach, with a central fund and effective coordination by the UN will save many more lives in the hours and days after a shock hits. It will reduce the chaos, confusion and delays caused by dozens of countries and agencies responding to the same disaster independently.

(Continue . . .)


With global economies in turmoil, and recessionary fears continuing to spread, finding money for many relief, humanitarian, or other worthwhile projects becomes more difficult. 


As reported earlier this month by IRIN:


. . . . money for HIV/AIDS efforts is not as plentiful as in previous years hardly comes as a surprise. UNAIDS notes that the global economic crisis appears to have put an end to a decade of funding increases by donors - after flattening out in 2009 for the first time, international AIDS assistance fell by 10 percent in 2010.


And the story is much the same around the globe for many other humanitarian, relief, and public health programs. 


Funding cuts - either already implemented or threatened - endanger the ability of government agencies and NGOs to provide the kind of aid and support they have in the past.


Last week in TFAH: 2011 Ready or Not Report on public health preparedness in the United States, they wrote that this year’s big concern is that the gains of the past few years may be eroded due to budgetary constraints.


The catch-22 to all of this is that the less well we are prepared to deal with disasters - the greater the impact these shocks may have on the global economy - further eroding our ability to prepare.


That was the theme of a blog I wrote last July (OECD Report: Future Global Shocks), where we looked at a 139 page report  released by the OECD (The Organisation for Economic Co-operation and Development) that warned - as the world becomes more interconnected and interdependent - that `Global Shocks’ to the world economy become more likely.


In the report, they define a Global Shock as: a rapid onset event with severely disruptive consequences covering at least two continents.

image

They write:


Extremely disruptive events, such as earthquakes, volcanoes, financial crises and political revolutions destabilize critical systems of supply, producing economic spillovers that reach far beyond
their geographical point of origin.

While such extreme events have been relatively rare in the past, they seem poised to occur with greater frequency in the future. Global interconnections accompanying economic integration enable some risks to propagate rapidly around the world.


While discussing a wide range of future shock scenarios, the authors concentrated most of their attention on five highly disruptive future shock events.

  • A Pandemic
  • A Cyber Attack
  • A Financial Crisis
  • A Geomagnetic Storm
  • Social Unrest/Revolution


They also make special note of the risks of increased antibiotic resistance, and the need for new antibiotics to be developed.


While you and I can do little about the level of international preparedness for disasters (other than being generous volunteering time or money to reputable NGOs), there remains an important role and responsibility for all of us; to be prepared to help ourselves, and our community, during any disaster.


Ultimately, a nation’s resilience in the face of a major crisis –whether it be local or global - comes from the bottom up, not from the top down. 


Which is why agencies, like the ones below, urge greater individual, family, and community preparedness.


FEMA http://www.fema.gov/index.shtm

READY.GOV http://www.ready.gov/

AMERICAN RED CROSS http://www.redcross.org/


A few of my preparedness blogs from the past include:


When 72 Hours Isn’t Enough
Planning To Survive
An Appropriate Level Of Preparedness
In An Emergency, Who Has Your Back?
The Gift Of Preparedness
»» Read More

The Birth Of The Flus


# 5963


Southeast Asia has long been considered `the cradle of influenza, an area of the world where influenza viruses circulate year round, more than a billion people live in close proximity, and where humans and farm animals often come into close contact with one another.


An ideal breeding ground, and launching pad, for flu pandemics. 


During the 20th century, 2 of the 3 influenza pandemics (1957 Asian Flu, 1968 Hong Kong Flu) originated from this region.


But new research on the the spread of influenza A, published yesterday in PNAS, indicates that Southeast Asia isn’t the only birthplace of the flu.


The dauntingly titled open access study can be found at:


Temporally structured metapopulation dynamics and persistence of influenza A H3N2 virus in humans

Published online before print November 14, 2011, doi: 10.1073/pnas.1109314108 PNAS November 14, 2011

Justin Bahl, Martha I. Nelson, Kwok H. Chan, Rubing Chen, Dhanasekaran Vijaykrishna, Rebecca A. Halpin, Timothy B. Stockwell, Xudong Lin, David E. Wentworth, Elodie Ghedin, Yi Guan, J. S. Malik Peiris, Steven Riley, Andrew Rambaut, Edward C. Holmes, and Gavin J. D. Smith


(EXCERPT)

Although the virus population that migrated between Southeast Asia and Hong Kong persisted through time, this was dependent on virus input from temperate regions and these tropical regions did not maintain a source for annual H3N2 influenza epidemics.


We further show that multiple lineages may seed annual influenza epidemics, and that each region may function as a potential source population. We therefore propose that the global persistence of H3N2 influenza A virus is the result of a migrating metapopulation in which multiple different localities may seed seasonal epidemics in temperate regions in a given year.


Such complex global migration dynamics may confound control efforts and contribute to the emergence and spread of antigenic variants and drug-resistant viruses.


The entire study is available online, but for those of us who find the finer details of Bayesian phylogeographic analysis of viral migration above our pay grade, we’ve a press release from Duke University Medical Center that helps summarize this paper.


Study finds tropical areas aren't the only source of seasonal flu

DURHAM, N.C. and SINGAPORE – A commonly held theory says that flu virus originates every year in Southeast and Eastern Asia, making this region the source of seasonal flu epidemics in other parts of the world.


However, researchers at Duke-NUS Graduate Medical School in Singapore have found that influenza virus in tropical areas isn't the only global source of flu epidemics. The international team of scientists involved in the work found that any one of the urban centers they studied could act as a source for a flu epidemic in any other locality.


"We found that these regions are just one node in a network of urban centers connected by air travel, through which flu virus circulates and causes a series of local epidemics that overlap in time," said Gavin Smith, PhD, senior author and Associate Professor in the Program in Emerging Infectious Diseases at Duke-NUS.


The study was published the week of Nov. 14 in the online Early Edition of the Proceedings of the National Academy of Sciences.


The research team chose to study influenza A because it is much more prevalent than both influenza B and C. Influenza is a significant cause of human illness and death worldwide – the World Health Organization estimates that 250,000 to 500,000 influenza A related deaths occur per year worldwide, and about 49,000 deaths occur in the United States.


The team obtained RNA sequences of virus samples from 2003 to 2006 in Australia, Europe, Japan, New York, New Zealand and Southeast Asia, as well as some more recently sequenced viruses from Hong Kong. The virus populations from tropical Southeast Asia and Hong Kong showed relatively low levels of genetic diversity and no seasonal fluctuations in comparison with annual temperate-area epidemics.


The analysis used time and space parameters to reveal high rates of viral migration among the urban centers tested. Although the virus population that migrated between Southeast Asia and Hong Kong persisted through time, the pattern of infections also depended on virus input from temperate regions that have distinct seasons. None of the temperate and tropical regions they examined was the source of all of the new flu strains in a given year.


The scientists showed that multiple lineages of a virus could seed annual flu epidemics, and that each region could function as a potential source population.

(Continue . . . )


Six weeks before the 2009 H1N1 pandemic virus emerged in Mexico, I wrote  blog called:


Sunday, March 08, 2009
How The Next Pandemic Will Arrive

# 2876

There is a lot we don't currently know about the next pandemic.  We don't know when it will arrive.  We don't know what virus will cause it.  And we don't know how bad it will be.


But there is one thing almost certain.


It will arrive in most countries by airplane.

The video above, which as been making the rounds for several months, was made by ZHAW (Zürcher Hochschule für Angewandte Wissenschaften) or The Zurich University of Applied Sciences.

(Continue . . .)


Before the advent and explosion in international air travel, the tropical regions of Southeast Asia probably played a much bigger role in the the creation, incubation, and spread of influenza viruses. 


With man’s help, influenza today has become an accomplished world traveler. No longer are we protected by vast oceans and long transit times.


New strains and viral reassortments that a few decades ago might have sputtered and died out unnoticed in some remote region of the world, or have been detected and quarantined aboard slow moving ships, can now hop a plane and find new hosts in a matter of hours.


Something we saw as recently as the 2009 H1N1 pandemic, which began not in Asia, but in the Americas.


Further proof that as the world evolves and become more complex, so does the threat from emerging infectious diseases.

»» Read More

WHOSIS: World Health Statistics 2011


# 5570


The World Health Organization’s 64th World Health Assembly, being held in Geneva (May 16–24), ends today (see WHO Media Centre).


One of the resources released to their 193 member nations, and to the public, during the past week is a compilation of global health statistics put together by WHOSIS (WHO Statistical Information System).


World Health Statistics 2011

World Health Statistics 2011 contains WHO’s annual compilation of health-related data for its 193 Member States, and includes a summary of the progress made towards achieving the health-related Millennium Development Goals (MDGs) and associated targets.


    Fact sheet N°290

DOWNLOAD THE FULL REPORT
Available in 3 languages


This report provides a comprehensive summary of the current status of national health and health systems in the following nine areas:

  • life expectancy and mortality
  • cause-specific mortality and morbidity
  • selected infectious diseases
  • health service coverage
  • risk factors
  • health workforce, infrastructure and essential medicines
  • health expenditure
  • health inequities
  • demographic and socioeconomic statistics.


You’ll find most of the information provided in tables, charts, graphs and maps.


image


While this report cites modest improvements in global health on a number of fronts (malnutrition, vaccines, lower child and material mortality rates, stabilization of number of new HIV infections), progress varies from country-to-country, and many significant challenges remain.


You’ll find an overview of some of the progress that has been made in the following Millennium Development Goals FAQ sheet.


Millennium Development Goals: progress towards the health-related Millennium Development Goals

Fact sheet N°290
May 2011


Key facts
  • Fewer children are dying. Annual global deaths of children under five years of age fell to 8.1 million in 2009 from 12.4 million in 1990.
  • Fewer children are underweight. The percentage of underweight children under five years old is estimated to have dropped from 25% in 1990 to 16% in 2010.
  • More women get skilled help during childbirth. The proportion of births attended by a skilled health worker has increased globally, however, in the WHO Africa and South-East Asia regions fewer than 50% of all births were attended.
  • Fewer people are contracting HIV. New HIV infections have declined by 17% globally from 2001–2009.
  • Tuberculosis treatment is more successful. Existing cases of TB are declining, along with deaths among HIV-negative TB cases.
  • More people have safe drinking-water, but not enough have toilets. The world is on track to achieve the MDG target on access to safe drinking-water but more needs to be done to achieve the sanitation target.

(Continue . . . )


The 2011 World Health Statistics report provides us with some sorely needed good news, and serves as a reminder of how much more needs to be done.

»» Read More

Global Influenza Activity: Week 52


# 5233


The World Health Organization releases their influenza surveillance reports every two weeks, and their latest – released yesterday – gives us a global glimpse of flu activity through the end of 2010.


A few excerpts (slightly reformatted for readability), but follow the links to read it in its entirety.


Influenza update - 14 January 2011

14 January 2011 - Summary:

North America is continuing to report increases in influenza activity primarily related to influenza A (H3N2) with lower numbers of influenza type B.

In the United Kingdom, severe and fatal cases are increased compared to 2 weeks ago, associated predominantly with influenza A (H1N1) 2009 and less commonly with influenza type B.

Currently, 25% of intensive care beds in the U.K. are occupied by influenza patients. Notably, the Chief Medical Officer has issued an alert to clinicians warning of increasing rates of bacterial infections often associated with influenza (S. pneumoniae, Group A streptococcus, and meningococcus), though the association with the current influenza circulation is still under investigation.

Severe disease associated with H1N1 (2009) and to a lesser extent influenza type B is also being increasingly reported on the European continent and areas of the Middle East. Tropical areas of the world and the temperate countries of the Southern Hemisphere are currently reporting very little influenza circulation.

image

(Dbl click on Map to Enlarge)


This week, we’ve a new report detailing the 2009 H1N1 oseltamivir (Tamiflu) resistant flu samples detected so far by WHO reporting regions.


Resistance is generally caused by a mutation, known as H275Y, where a single amino acid substitution (histidine (H) to tyrosine (Y)) occurs at the neuraminidase position 275.


Resistance most often develops spontaneously in a person while they are taking oseltamivir, which is a concern for that patient, but only becomes a wider issue if the resistant virus is passed on to others.


In 2008 the old seasonal H1N1 virus went from almost always sensitive to the antiviral to completely resistant, because the virus picked up the mutations needed to convey resistance and transmit efficiently.


Thus far, that has not happened with the new 2009 H1N1 virus, with less than 2% of samples examined showing the H275Y mutation.   The concern is, of course, that over time that could change.


Three new samples were detected in the latest reporting period (29 December 2010- 12 January 2011), bringing the cumulative total to 319.


Update on oseltamivir resistance to influenza H1N1 (2009) viruses


image

»» Read More

Global Influenza Report: Week 42


# 5042


With the end of the declared pandemic, the World Health Organization has dropped back to providing a global flu update to once every 2 weeks. 


This report – current as of week 42 – was released on Nov 8th.


H3N2 continues to be the predominant player around the world, and in most countries, is overshadowing the 2009 H1N1 strain. 


Influenza B is circulating as well, and is particularly prevalent in the southern hemisphere as a late-season strain.


Some excerpts, but follow the link to read the whole thing.


image

Description: Displayed data reflect the most recent information reported to FluNet, WHO regional offices or on ministry of health websites in the last 2 weeks.


The percent of specimens tested positive for influenza includes all specimens tested positive for all influenza subtypes. The pie charts show the distribution of virus subtypes among all specimens that were tested positive for influenza.


Influenza - Update 120

8 November 2010 - Summary:

Worldwide, overall influenza activity remained low, except in parts of the tropics, most notably in Southeast Asia, and to a lesser extent in the tropical areas of the Americas. After late winter and springtime influenza epidemics in several countries of the temperate southern hemisphere, influenza activity has returned to near or below baseline in most places.


Notably, however, a recent post-season rise in cases has been noted across parts of southern Africa associated with localized outbreaks of influenza H1N1 (2009) virus.

Seasonal influenza A(H3N2) viruses continued to be the predominant circulating type or subtype of influenza viruses worldwide, however, in addition, in many countries there has been co-circulation of seasonal influenza B viruses and to a lesser extent, influenza H1N1 (2009) viruses. The latter has been recently predominant in a limited number of countries, including in India.


Virological surveillance

The WHO Global Influenza Surveillance Network is constantly monitoring the evolution of influenza viruses. Like other influenza viruses, the influenza H1N1 (2009) viruses have being undergoing genetic evolution. Since their emergence, variants having substitutions at residues 125/142, 222 and/or 374/391 in the haemagglutinin gene have been detected. Recently other genetic mutations have also been reported.

However, antigenic characterization to date has shown that all these viruses are not antigenically distinguishable from the vaccine virus A/California/7/2009.

FluNet reports

During weeks 41 to 42 (10 -23 October, 2010), National Influenza Centres (NICs) from 31 countries reported data to FluNet*. A total of 1,749 specimens were reported as positive for influenza viruses, 1,512 (86.4%) were typed as influenza A and 237 (13.6%) as influenza B. Of the sub-typed influenza A viruses reported, 15.6% were influenza H1N1(2009) and 84.0 % were influenza A(H3N2).


The number of countries, regions, and territories reporting since the height of the pandemic has dropped by nearly 2/3rds, but the following gives some indication of the relative distribution of virus strains reported in the northern hemisphere since mid-summer.


image


As you can see, H3N2 (light blue) has been the predominate strain identified in the northern hemisphere since early August, while the 2009 H1N1 strain (yellow) has declined.


Past performance is no guarantee of future results, but the upward trend in the H3N2 virus over the past few months has some observers concerned that we may see a tough flu season ahead. 


Years where H3N2 dominates tend to be more severe than years where H1N1 is the major strain in circulation.


The good news is, it isn’t too late to get your flu shot.


This year’s shot provides coverage for both the 2009 H1N1 and and the Perth H3N2 strains, along with a B strain.

»» Read More

Global Flu Activity Update


Note: Today is my last full day of my mini vacation, so a brief entry and unless there’s some breaking news, I may not update this blog again until my return Sunday.


# 4788


The World Health Organization (WHO) reports this week that the levels of pandemic and seasonal flu activity were most pronounced in parts of South Asia and limited areas of tropical South and Central America.


India continues to report significant numbers of H1N1 cases, although it does not appear to be as bad as during the peak of their pandemic wave in 2009.


Pandemic (H1N1) 2009 - update 112

(EXCERPT)

In the temperate zone of the southern hemisphere, overall seasonal and pandemic influenza activity remains low, except in South Africa, where peak wintertime influenza transmission due to circulating seasonal influenza viruses (H3N2 and type B) might have recently occurred.

Seasonal influenza viruses, particularly H3N2 viruses, continue to circulate in parts of Central America, East Africa, and Southeast Asia.


From the WHO’s Weekly Virological Update , we get a snapshot of the circulation of viruses in the Southern Hemisphere in 2010.


image

image


The CDC’s  International Flu Activity Update  describes the situation this way.


2009 H1N1 Flu: International Situation Update


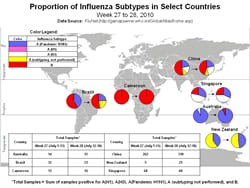
This picture depicts a map of the world that shows the co-circulation of 2009 H1N1 flu and seasonal influenza viruses. Australia, Brazil, Cameroon, Chile, China, New Zealand, and Singapore are represented. There is a pie chart for each that shows the proportion of laboratory-confirmed influenza cases that have tested positive for either 2009 H1N1 flu or other influenza subtypes. The majority of laboratory-confirmed influenza cases reported in Australia in weeks 27 and 28 were 2009 H1N1 flu.

This report provides an update to the international flu situation using data collected through July 25, 2010, and reported by the World Health Organization (WHO) on July 30.

Global Flu Activity Update

WHO continues to report laboratory-confirmed 2009 H1N1 flu deaths on its Web page.  These fatal cases are an under-representation of the actual numbers, as many deaths are never tested or recognized as flu related.

Overall, flu activity due to 2009 H1N1 and seasonal flu viruses is low worldwide.  However, some tropical regions, such as areas of the Americas and South and Southeast Asia, continue to report high levels of flu activity related to seasonal flu or 2009 H1N1.  In the Northern Hemisphere, flu activity has been low or sporadic.

Southern Hemisphere

In the Southern Hemisphere, levels of flu activity vary by location. There is low, but increasing, flu activity in Australia and New Zealand.  In Australia, 2009 H1N1 is the most common virus strain, followed by influenza A (H3N2) viruses. 

Virologic data from South Africa suggests flu activity has peaked, but remains elevated, mostly due to seasonal influenza B and A (H3N2) viruses.  Overall, levels of influenza-like illness (ILI) in Chile remain low, except in the Los Lagos region.  The majority of flu viruses in Chile and Argentina are 2009 H1N1 and seasonal B viruses. In tropical regions of the Americas, 2009 H1N1 and seasonal flu virus activity was reported in early July.

Asia

In Asia, India reported the most 2009 H1N1 activity. Low levels of 2009 H1N1 activity were also detected in several Southeast Asia countries, including Cambodia, Singapore and Malaysia. Singapore continues to report high levels of seasonal A (H3N2) activity.

Africa

In Sub-Saharan Africa, seasonal A (H3N2) and B viruses continue to circulate in parts of Kenya and central Africa (Cameroon), and pandemic flu transmission continues in Ghana.

Selected Highlights
  • According to WHO, the majority of 2009 H1N1 virus isolates tested worldwide remains sensitive to oseltamivir, an antiviral medicine used to treat flu. Among 2009 H1N1 isolates tested worldwide, 302 have been found to be resistant to oseltamivir as of July 21st.  Approximately 1% of U.S. 2009 H1N1 viruses tested by CDC since September 1, 2009, have been resistant to oseltamivir.
  • Globally 50.7% of subtyped influenza A viruses were 2009 H1N1, according to WHO data collected from July 11-17, 2010, and reported on July 28.
»» Read More

Global Flu Activity Update


# 4737


Since it is summer, as one might expect, influenza activity remains low in North America and most of Europe.  South of the equator and in tropical regions, however, flu-like illnesses are far more prevalent.


A couple of reports on the global flu trends this morning.  One from the World Health Organization and the other from PAHO.


While pandemic H1N1 continues to circulate - currently nowhere are we seeing alarming levels of influenza activity – although a number of countries are reporting rates of illness typical for this time of year.


The latest WHO update (week 26 – ending July 3rd) highlights the mixtures of laboratory typed flu strains from several reporting countries.  


As you can see, reports of seasonal H3N2’s demise last fall were premature. It continues to circulate in Mexico, Brazil, Argentina, South Africa, Australia, and parts of South East Asia.


image

(click to enlarge)


PAHO (Pan American Health Organization) meanwhile has their latest report on influenza activity in the Americas.


Regional Update, Pandemic (H1N1) 2009. (Published on July 19, 2010)

The information contained within this update is obtained from data provided by Ministries of Health of Member States and National Influenza Centers through reports sent to Pan American Health Organization (PAHO) or updates on their web pages.

To download the full report in PDF click here . icon

Weekly Update

    • In South America, Colombia and Peru reported an increasing trend of acute respiratory disease.
    • In Central America, El Salvador reported an increasing trend in acute respiratory disease.
    • In the Caribbean, Dominica reported an increasing trend in acute respiratory disease.
    • In North America, acute respiratory disease activity remained low.
    • The respiratory viruses circulating in Central America and Caribbean are diverse, with different predominance of influenza viruses (H1N1 pandemic, seasonal influenza A H3N3 and influenza B) in each country.
    • 2 new confirmed deaths in 2 countries were reported; in total there have been 8,525 cumulative confirmed deaths in 28 countries of the Region.


image

»» Read More

ECDC: Global Vaccine Goals And Realities


# 4700


From the ECDC this morning, a review of our recent track record in producing a pandemic vaccine compared to the the goals and expectations of a little more than a year ago.


Since 2006 the World Health Organization has been actively working with the private sector to increase global pandemic vaccine capacity, initially in response to the perceived threat from the H5N1 virus.


In September of  2006 they released their Global Action Plan (GAP) for vaccine production titled:


Global pandemic influenza action plan to increase vaccine supply [pdf 510kb]


In October of 2007, the WHO released this decidedly optimistic assessment of vaccine manufacturing prospects by the year 2010:


Projected supply of pandemic influenza vaccine sharply increases

23 OCTOBER 2007 | GENEVA -- Recent scientific advances and increased vaccine manufacturing capacity have prompted experts to increase their projections of how many pandemic influenza vaccine courses can be made available in the coming years.


Last spring, the World Health Organization (WHO) and vaccine manufacturers said that about 100 million courses of pandemic influenza vaccine based on the H5N1 avian influenza strain could be produced immediately with standard technology. Experts now anticipate that global production capacity will rise to 4.5 billion pandemic immunization courses per year in 2010.

(Continue . . .)


In May of 2009, several weeks after the emergence of the novel H1N1 virus,  Dr. Marie-Paule Kieny, director of the WHO's Initiative for Vaccine Research, estimated  (via CIDRAP Experts to discuss swine flu vaccine decision May 14) global vaccine production as:


. . . .  somewhere between 1 billion and 2 billion doses in a year, based on an estimated seasonal vaccine capacity of about 900 million doses. Current world population is more than 6 billion.


"Being conservative, we think there'll be at least between 1 and 2 billion doses," she said.

An even more aggressive manufacturing projection came from a May document called Recommendations of the Strategic Advisory Group of Experts (SAGE) on Influenza A (H1N1) vaccines.


A review of 2009 production status for northern hemisphere seasonal vaccine indicates that industry plans to produce approximately 480 million doses of trivalent seasonal vaccine in 2009. Of this, 350 and 430 million doses will be available by 30 June and 31 July 2009, respectively.


For influenza A (H1N1), it is estimated that up to 4.9 billion doses could be produced over a 12‐month period after the initiation of full scale production if: 

  1. There is a vaccine yield equivalent to that routinely obtained for seasonal vaccine and the use of the most dose‐sparing formulations. 
  2. In this situation, there is a potential access for the UN of supplies of up to 400 million doses. 


But things did not go nearly so well as hoped and the global production of vaccine fell far short of these estimates.


In fairness, the yield from the seed virus proved less than anticipated and the use of adjuvants – to reduce the amount of antigen needed per shot – was met with public resistance.


image


On the plus side (and this isn’t well appreciated), the vaccine produced came off the assembly line sooner than expected (albeit in small quantities), and has proven to be both safe and effective.


Which has to be seen as a considerable victory, even if the ultimate number of doses produced was disappointing.


The irony is, had the WHO’s projections been met over the past year, they would likely be subject to even more bashing from their critics over the costs and `waste’ given the ultimate mildness of the pandemic and  the general public apathy towards getting vaccinated.


Proving, I suppose, that public health is often a thankless job.


Of course, the next time a virus emerges, we may not be quite so lucky. It could be highly virulent, and the demand for a vaccine extremely pressing.


So the need to bolster global vaccine manufacturing capacity remains.


Earlier this year CIDRAP covered many of these issues with:


H1N1 LESSONS LEARNED: Vaccine production foiled, confirmed experts' predictions

WHO: Pandemic showed limits of vaccine production capacity


Here’s the link to the ECDC report, including their commentary.


06 Jul 2010

WHO surveys on global production of seasonal and pandemic (H1N1) influenza vaccines in 2009–2010 – what was planned and what happened. Also comparison with global action plan targets

Partridge J, Kieny M-P, the World Health Organization H1N1 Influenza Vaccine Task Force; Vaccine 2010 May 18. Initiative for Vaccine Research, World Health Organization, Geneva; Vaccine 2010 May 17. [Epub ahead of print]


In September 2006 the WHO published the Global pandemic influenza action plan to increase vaccine supply (GAP) in an attempt to increase the production capacity for seasonal influenza vaccines thus contributing to meet the vaccine demand during an influenza pandemic [1]. The short term goal of the GAP was to enable the production of a pandemic vaccine sufficient to immunise 2 billion people within 6 months from the availability of a pandemic virus vaccine.

(Continue . . . )


And here is a link to the Global Vaccine deployment figures as of July 2nd, 2010.


image

»» Read More

Global Flu Trends: Week 24


# 4696


Overall, reporting of influenza remains subdued, although there are some signs of slight increases in influenza-like activity in the southern hemisphere.  


Once again, seasonal H3N2 is part of the mix being reported in some countries, which means we may have two influenza A strains to contend with this fall. 


The good news is, H3N2 is included in this fall’s seasonal flu shot, along with novel H1N1, and the  B/Brisbane/60/2008-like virus.


The bad news is, since the new strain of H3N2 (A/Perth/16/2009) has drifted antigenically away from the previous strain, those who don’t get vaccinated may find themselves without much in the way of acquired immunity this fall.

First a look at this week’s Virological report from the World Health Organization, and then the CDC’s latest International Update.


Weekly Virological Update on 30 June 2010

Virological Surveillance, week no. 24 (13 to 19 June 2010)

Summary on week 24
  • Overall influenza activity has remained at low levels in most parts of the world.
  • In Northern Hemisphere the number of influenza type B virus detections exceeded that of influenza A.
  • However, the detection of influenza A increased in South Hemisphere with the co-circulation of A(H1N1)2009 pandemic virus and seasonal A(H3N2).

Global Virological Surveillance

Influenza B viruses continued to be predominating in some countries and areas of Northern Hemisphere, including China (69.7% of all influenza detections) and Russian Federation (86.7%). Sporadic influenza B activity has also been observed in some other countries.


Sporadic influenza A activity was reported in some countries in the Southern Hemisphere, including Australia, Brazil, Chile and South Africa. The proportion of A(H3N2) increased in Australia and South Africa while A(H1N1)2009 pandemic virus was reported as predominant virus in Brazil and Chile.

FluNet Report

The total number of specimens reportedly positive for influenza viruses by National Influenza Centres (NICs) from 20 countries was 218. Of these, 117 (53.7%) were typed as influenza A and 101 (46.3%) as influenza B.


From the start of the pandemic in 19 April 2009 to 19 June 2010, the total number of specimens reported positive for influenza by NIC laboratories was 644,883*. Of these, 489,229 (75.9%) were pandemic A(H1N1), 8,923 (1.4%) were seasonal A(H1N1), 32,897 (5.1%) were A(H3N2), 80,669(12.5%) were A (not subtyped) and 33,046(5.1%) were influenza B.


From the CDC we get this International update for week 23 to 24.   As you can see, H3N2 continues to circulate in Singapore, South Africa, and Chile.


image


2009 H1N1 continues to actively circulate in certain areas of the tropics, including the Caribbean, West Africa, and South and Southeast Asia. In the Southern Hemisphere, influenza A (H3N2) viruses are currently co-circulating with 2009 H1N1. In the Northern Hemisphere, the number of influenza B viruses detected has exceeded reports of influenza A.


Influenza A (H3N2) activity is currently increasing in Nicaragua and circulating at low levels in South Africa, Australia, East Africa, and South America. Low levels of 2009 H1N1 influenza activity have been reported from Chile and Argentina. 2009 H1N1 activity continues to increase in Southern regions of India and is circulating at low levels in several countries in Southeast Asia. Influenza type B continues to actively circulate in Central and Southern regions of Africa and is currently co-circulating with 2009 H1N1 in Bangladesh.

Selected Highlights
  • According to WHO, the majority of 2009 H1N1 virus isolates tested worldwide remains sensitive to oseltamivir, an antiviral medicine used to treat flu. Among 2009 H1N1 isolates tested worldwide, 298 have been found to be resistant to oseltamivir – as of May 28, 2010, 67 of these isolates were detected in the United States. Approximately 1% of U.S. 2009 H1N1 viruses tested by CDC since September 1, 2009, have been resistant to oseltamivir.
  • Influenza B continues to predominate in many countries of the Northern Hemisphere, including China (69.7% of all influenza detections) and the Russian Federation (86.7%).
  • The proportion of influenza A (H3N2) detections increased in Australia and South Africa, while 2009 H1N1 is circulating as the predominant virus in Brazil and Chile. On February 18, 2010, WHO published recommendations for the following viruses to be used for influenza vaccines in the 2010-2011 influenza season of the Northern Hemisphere:
    • an A/California/7/2009 (H1N1)-like virus;
    • an A/Perth/16/2009 (H3N2)-like virus*;
    • a B/Brisbane/60/2008-like virus.

* A/Wisconsin/15/2009 is an A/Perth/16/2009 (H3N2)-like virus and is a 2010 Southern Hemisphere vaccine virus.

»» Read More