Showing posts with label epidemic. Show all posts

Puerto Rico Declares Dengue Epidemic


# 6622


Dengue fever is endemic in Puerto Rico, but most years the number of cases remains relatively low.  Every few years, however, dengue resurges and an epidemic occurs.


Last year (2011) was an average or below average year for Dengue in Puerto Rico, but the year before – 2010 – saw the worst epidemic in modern memory (see MMWR: Dengue Epidemic In Puerto Rico) with nearly 21,000 cases and 31 fatalities.


This year, the level of Dengue fever infection has been flirting with the epidemic threshold off and on (see Dengue Above Epidemic Threshold In Puerto Rico), but in recent weeks has begun to climb higher.


The most recent surveillance report – current through the middle of September – shows this upward trend.

image


Yesterday Health Secretary Lorenzo Gonzalez of the Puerto Rico Health Department declared a Dengue epidemic on the island (PDF Link – in Spanish) and stated that at least six people have died, two of them being children.


The World Health Organization’s Dengue and Severe Dengue Fact Sheet highlights the following points about the disease.

Key facts
  • Dengue is a mosquito-borne viral infection.
  • The infection causes flu-like illness, and occasionally develops into a potentially lethal complication called severe dengue.
  • The global incidence of dengue has grown dramatically in recent decades.
  • About half of the world's population is now at risk.
  • Dengue is found in tropical and sub-tropical climates worldwide, mostly in urban and semi-urban areas.
  • Severe dengue is a leading cause of serious illness and death among children in some Asian and Latin American countries.
  • There is no specific treatment for dengue/ severe dengue, but early detection and access to proper medical care lowers fatality rates below 1%.
  • Dengue prevention and control solely depends on effective vector control measures.


The explosive growth of Dengue around the world is well illustrated by the following graph, again from the World Health Organization.


Dengue Trends


There are 4 different serotypes of the Dengue Fever virus (Puerto Rico is reporting types DENV1 & DENV4), so a person can become infected several times over their lifetime. Usually, the first infection with a dengue virus results in the milder form of the illness, while more serious illness can occur with subsequent infections.


With roughly 4 million residents and another 4 million annual visitors to Puerto Rico – 4,8165 infections is a miniscule fraction of the exposed population.


The odds of contracting the virus are actually pretty low.  


But they are not zero.


So it makes sense to take reasonable precautions whenever you are around mosquitoes (and not just in Puerto Rico). Those who travel to, or live in areas where mosquitoes are present are reminded that to  follow the `5 D’s’:

image


You can find out more about dengue around the world by visiting the CDC’s Traveler’s Health page on the disease: Update: Dengue in Tropical and Subtropical Regions

»» Read More

Dr. Anne Schuchat: Live Speech Today Online


# 5214

Anne Schuchat, MD (RADM, USPHS)

Admiral Anne Schuchat - director of the National Center for Immunization and Respiratory Diseases, and Assistant Surgeon General of the United States – was regarded by myself, along with many others, as perhaps the best communicator at the CDC during the 2009 pandemic.


She managed to convey rapidly changing, unscripted information clearly and concisely – while acknowledging the things about the virus that were still unknown – in almost daily briefings during the opening  months of the outbreak.


Not an easy job.


Dr. Schuchat will be speaking live later today at Duke University on the challenges of monitoring and containing influenza epidemics and lessons learned from past epidemics such as H1N1 and SARS.


You can watch this speech on the Duke University USTREAM video channel at 5:45pm EST, today (Sunday 1/9/11) at:


http://www.ustream.tv/DukeUniversity


My thanks go to Carol@SC at the Flu Wiki for posting this notice.

»» Read More

UK: On The Cusp Of A Flu Epidemic


# 5190


While the latest numbers from the HPA haven’t been released yet, British media sources are quoting the Royal College of General Practitioners as stating that influenza cases rose by 50% last week.


Assuming those numbers hold true, then the UK remains below the epidemic threshold.


But not by much.


And among certain age groups, and in some geographic locations, epidemic levels of influenza are probably already being seen (defined as 200 case consults/100K pop.).


While the rest of the northern hemisphere lags behind with average (or below average) influenza activity, the UK is being hit hard - and unusually early - with influenza and other winter ailments.


With schools back in session after the Christmas Holiday (generally Dec 20th-Jan 3rd) early next week, concerns are that influenza rates may rise even further, meeting or perhaps even exceeding the rates seen in the 1999-2000 flu epidemic.


Since all flu viruses aren’t created equal, comparing epidemics based on total numbers infected doesn’t tell us much about the ultimate severity (and death toll) of an outbreak.


Unlike most seasonal flu strains, novel H1N1 tends to infect those under the age of 65, who are (on average) stronger and healthier and less likely to succumb to influenza than the elderly.


Although H1N1  can cause serious illness in a small percentage of victims – most people recover without incident.  So it remains unclear how heavy the impact from this year’s influenza outbreak will turn out to be.


That said, the `official’ number of cases and deaths attributed to the flu virus are widely assumed to be a badly undercounted, and the demands placed on the NHS over the next several weeks are likely to be heavy.


A representative round up of some of this morning’s reportage from the UK media includes:


Swine flu fears give NHS 24 its busiest four-day period ever The Scottish Herald


Number Of Flu Hospital Patients 'Rises Again' Sky News


Warning as NHS prepares for flu rush Shields Gazette


Doctors urging caution after flu cases rise South Wales Evening Post


I’ll try to update this story later today,  when the HPA is expected to release their weekly surveillance numbers.

»» Read More

The Impact Of Mass Gatherings & Travel On Flu Epidemics


# 5180


A timely study this morning, published in BMC Public Health, that looks at and attempts to quantify the impacts of mass gatherings and holiday travel on the spread of an influenza epidemic.


With the UK poised on the brink of their epidemic threshold this holiday season, we may well see this effect at work over the next several weeks.


Of course, the notion that influenza epidemics can surge in the wake of large gatherings of people is hardly new. During the 1918 Pandemic, most cities instituted strict public health ordinances.   They closed schools, movie houses, pool rooms, restaurants . . even churches.


Those cities that took these measures generally saw much lower levels of death and illness.


But Philadelphia went ahead with a massive Liberty Loan parade on September 28th of that year, apparently heartened by the low number of flu cases reported in Pennsylvania to that point.


Thousands gather in the streets of Philadelphia for the Liberty Loan Parade.

Days after Philadelphia’s Liberty Loan parade in September 1918, which was attended by 200,000 people, hundreds of cases of influenza were reported. [Credit: Naval Historical Center]


What happened next is best demonstrated by the following graph, which depicts an explosion of pandemic flu cases beginning just days after the parade.


The chart above, taken from the PNAS journal article entitled Public Health Interventions and Pandemic Intensity During the 1918 Influenza Pandemic , shows the excess mortality in two American cities.

The tall spike represents Philadelphia, while the lower curve represents St. Louis.


Over the next three weeks, at least 6,081 deaths from influenza and 2,651 deaths from pneumonia were registered in Pennsylvania, most occurring in Philadelphia (CDC source).


A more recent example comes from the 2009 H1N1 pandemic, which appears to have been efficiently disseminated around the world due to the number of Spring Break vacationers returning from Mexico during the initial outbreak.


But that was then, this is now.


With the exception of the UK (and possibly parts of eastern Europe), influenza appears to be simmering at fairly low levels in most parts of the northern Hemisphere.


The next eight weeks, however, will see a number of large public gatherings (i.e. Super Bowl, Carnival in Rio) and the busiest travel holiday of the year – Chinese New Years. 


Any of which have the potential to spark a resurgence of the flu. Which brings us to the BMC Journal study, called:


The impact of mass gatherings and holiday traveling on the course of an influenza pandemic: a computational model


Pengyi Shi, Pinar Keskinocak , Julie L Swann  and Bruce Y Lee

BMC Public Health 2010, 10:778doi:10.1186/1471-2458-10-778

Published:21 December 2010

Abstract (provisional)
Background

During the 2009 H1N1 influenza pandemic, concerns arose about the potential negative effects of mass public gatherings and travel on the course of the pandemic. Better understanding the potential effects of temporal changes in social mixing patterns could help public officials determine if and when to cancel large public gatherings or enforce regional travel restrictions, advisories, or surveillance during an epidemic.

Methods

We develop a computer simulation model using detailed data from the state of Georgia to explore how various changes in social mixing and contact patterns, representing mass gatherings and holiday traveling, may affect the course of an influenza pandemic.  Various scenarios with different combinations of the length of the mass gatherings or traveling period (range: 0.5 to 5 days), the proportion of the population attending the mass gathering events or on travel (range: 1% to 50%), and the initial reproduction numbers R0 (1.3, 1.5, 1.8) are explored.

Results

Mass gatherings that occur within 10 days before the epidemic peak can result in as high as a 10% relative increase in the peak prevalence and the total attack rate, and may have even worse impacts on local communities and travelers' families. Holiday traveling can lead to a second epidemic peak under certain scenarios.

Conversely, mass traveling or gatherings may have little effect when occurring much earlier or later than the epidemic peak, e.g., more than 40 days earlier or 20 days later than the peak when the initial R0 = 1.5.

Conclusions

Our results suggest that monitoring, postponing, or cancelling large public gatherings may be warranted close to the epidemic peak but not earlier or later during the epidemic. Influenza activity should also be closely monitored for a potential second peak if holiday traveling occurs when prevalence is high.

The complete article is available as a provisional PDF. The fully formatted PDF and HTML versions are in production.


Of course, as Professor Emeritus of Statistics at the University of Wisconsin George E. P. Box famously observed:


“All models are wrong, but some models are useful.”


And the authors of this study readily admit that there are limitations to computational studies such as this. They write:


Computer simulations by definition are simplifications of real life. Rather than make decisions, they can identify potentially important factors and relationships for decision makers.

Our model does incorporate a number of assumptions and cannot fully capture every possible factor or effect.


Each year, epidemiologists watch Chunyun, or the Spring Festival Travel Season (of which Chinese New Years is a central part) with particular fascination.


It is, quite rightfully, billed as the largest annual migration of humans on the planet. Chunyun begins about 15 days before the Lunar New Year and runs for about 40 days total.


This year, the Lunar New year falls on February 3rd, and with it comes a cultural ethic for millions who have moved to the big cities to return home to visit with their families.


These travelers will spend a few days in their home village or town, and then travel back to the city where they work or attend school. Which can provide ample opportunities for an infectious disease to hitch a ride.


Of course, it should be pointed out that last year, Chunyun did not precipitate a major resurgence in the H1N1 pandemic virus across Asia. 


Nor did we see any feared third wave of influenza following Carnival in Rio, the Super Bowl, or the the World Cup in South Africa.


And while there are yearly concerns about bird flu being brought back to the cities from rural locations by Chunyun travelers, that doesn’t appear to have happened (yet) either.


All of which means that just because the potential exists, that doesn’t guarantee that something bad will happen.  


Of course, the fact that it didn’t happen last year doesn’t preclude it from happening this year . . . or in the future.


So we’ll watch for signs that family gatherings and travel during this Holiday season may have exacerbated the the flu epidemic in the UK.  And we’ll keep a watchful eye on influenza activity and spread in the wake of this year’s Super Bowl, Carnival, and Chunyun. 


With luck, and over time, with the data we get from computer simulations like the one above - and from observations from the real-life laboratory of the world - we’ll learn a lot more about how, why, and under what conditions influenza is most likely to spread.


Valuable information during any influenza season, but of particularly importance should we ever face another virulent pandemic.

»» Read More

There Once Was A Virus From Norway . . .


There once was a virus from Norway
That spread in a relative poor way
But since influenza can drift
or worse it could shift!
It could always discover one more way


# 5011


The not-unexpected news last week that the 2009 H1N1 virus has `drifted’ slightly (see Eurosurveillance On Recently Isolated H1N1 Mutations), and concerns over the still-rare `Norway’ mutation (see D222G And Deep Lung Infections), remind us that influenza is a moving target and that changes in the virus are not only possible . . . they are inevitable.


Last year, in the opening days of the pandemic, I described (see Pandemic Variables) the process this way.


A pandemic isn’t a static event, and the virus – carried simultaneously by millions of hosts – doesn’t change direction and speed in concert like a school of fish.


Instead, what you have are millions of hosts incubating trillions of virus particles – with mutational changes occurring all of the time.  Most of these changes do not benefit the virus and lead nowhere, but out of trillions of rolls of the dice, some small number do.


It is survival – and propagation – of the biologically fittest.


Evolution in action.


With viruses that are better adapted to humans out-replicating, out-shedding, and out-transmitting lesser versions of the pandemic strain.


And that means that the virus we have in circulation today may not be the same virus we have running around in the fall, next winter, or next year sometime.   We could potentially see changes in virulence or antiviral sensitivity over time.


Prophetic?  


Hardly.  This is a process that happens every year.   Which is why we need a new, and updated, flu vaccine formulation each year.


Most of the time these changes are small, incremental, and have relatively little impact on virulence. 


Rarely, as in the case of a pandemic, we see a major shift in the influenza virus, which can affect its severity or transmissibility (or both).  


But a major shift doesn’t always spark a pandemic. On very rare occasions, the influenza virus can just temporarily go rogue.


Which brings us to one of the great medical mysteries of the last century:  The largely unexplained, but nonetheless fascinating  Liverpool Killer Flu of 1951.

image


This startling graphic comes from the March 16th, 1951 Proceedings of The Royal Society of Medicine – page 19 – and shows in detail the tremendous spike in influenza deaths in early 1951 over the (admittedly, unusually mild) 1948 flu season. 


For most of the world, however, 1951 remained an average flu year.  The dominate strain of influenza that year was the so-called `Scandinavian strain', which produced mild illness in most of its victims.


In fact, if you look at the graph for the United States, running from 1945 to 1956, you'll see nary a blip.
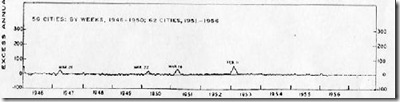
 

1946-1956


But in December of 1950 a new strain of virulent influenza appeared in Liverpool, England, and by the end of the flu season, had spread across much of England, Wales, Canada and even parts of the US.


The CDC's EID Journal  has a stellar account of this 1951 evemt, and much of what follows I've gleaned from this report:


Viboud C, Tam T, Fleming D, Miller MA, Simonsen L. 1951 influenza epidemic, England and Wales, Canada, and the United States. Emerg Infect Dis [serial on the Internet]. 2006 Apr [date cited].

ABSTRACT

Influenza poses a continuing public health threat in epidemic and pandemic seasons. The 1951 influenza epidemic (A/H1N1) caused an unusually high death toll in England; in particular, weekly deaths in Liverpool even surpassed those of the 1918 pandemic.


We further quantified the death rate of the 1951 epidemic in 3 countries. In England and Canada, we found that excess death rates from pneumonia and influenza and all causes were substantially higher for the 1951 epidemic than for the 1957 and 1968 pandemics (by >50%).


The age-specific pattern of deaths in 1951 was consistent with that of other interpandemic seasons; no age shift to younger age groups, reminiscent of pandemics, occurred in the death rate. In contrast to England and Canada, the 1951 epidemic was not particularly severe in the United States.


Why this epidemic was so severe in some areas but not others remains unknown and highlights major gaps in our understanding of interpandemic influenza.


According to this study, the effects on the city of origin, Liverpool, were horrendous.


In Liverpool, where the epidemic was said to originate, it was "the cause of the highest weekly death toll, apart from aerial bombardment, in the city's vital statistics records, since the great cholera epidemic of 1849" (5). This weekly death toll even surpassed that of the 1918 influenza pandemic (Figure 1)
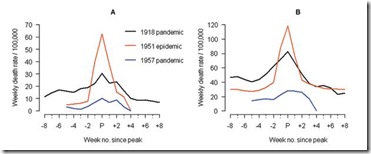
 

liverpool


This extraordinary graph shows the excess deaths in Liverpool during this outbreak (red line),  while the black line shows the peak deaths during the 1918 pandemic.  This chart shows excess deaths by   A) respiratory causes (pneumonia, influenza and bronchitis) and B) all causes.


For roughly 5 weeks Liverpool saw an incredible spike in deaths due to this new influenza.   And it did not remain localized to Liverpool. 


While it appears not to have spread as easily as the dominant Scandinavian strain, it managed to infect large areas of England, Wales, and Canada over the ensuing months.


The authors of this study describe the spread of this new influenza:


Geographic and Temporal Spread

Influenza activity started to increase in Liverpool, England, in late December 1950 (5,13). The weekly death rate reached a peak in mid-January 1951 that was ≈40% higher than the peak of the 1918–19 pandemic, reflecting a rapid and unprecedented increase in deaths, which lasted for ≈5 weeks [5 ] and Figure 1).


Since the early 20th century, the geographic spread of influenza could be followed across England from the weekly influenza mortality statistics in the country's largest cities, which represented half of the British population (13). During January 1951, the epidemic spread within 2 to 3 weeks from Liverpool throughout the rest of the country.


For Canada, the first report of influenza illness came the third week of January from Grand Falls, Newfoundland (19). Within a week, the epidemic had reached the eastern provinces, and influenza subsequently spread rapidly westward (19).


For the United States, substantial increases in influenza illness and excess deaths were reported in New England from February to April 1951, at a level unprecedented since the severe 1943-44 influenza season. Much milder epidemics occurred later in the spring elsewhere in the country (9).


For reasons we don't understand, this new strain never managed to spread much beyond England, Wales, Canada, and parts of New England.


It dissipated as suddenly as it appeared, failing to return the following year.


Whatever change or mutation sparked this sudden surge in virulence remains a medical mystery.


None of this is offered as a prediction as to what the H1N1 virus will do next. Frankly, I’ve no special insight into what the recently reported swine flu variant, or the `Norway D222G’ mutation will mean over time.


I present this bit of influenza lore simply because I find it intriguing, and it demonstrates that even seasonal flu can be a highly unpredictable, and oft times dangerous pathogen.


Even in a non-pandemic influenza season.

»» Read More

Study: Pandemic Mitigation by Early School Closure


# 4758


One of the first steps taken by many countries to reduce the spread of novel H1N1 last year was the closing of schools in affected communities.


By early May (2009) it was apparent that the severity of this particular influenza virus was less than originally feared, and many public health agencies moderated their recommendations  (see CDC No Longer Recommending School Closures For A/H1N1).


But a future, more severe pandemic, the extended closing of schools will once again likely be considered to help reduce the spread of the virus.


It isn’t an easy decision, however.  School closings are controversial, and the issues complex  (see The Debate Over School Closures).


Working parents rely on schools to watch their kids for much of the year during the day, and many low income families benefit from the school lunch program.  And of course, when schools are closed during a pandemic, some kids may congregate elsewhere and spread the virus anyway.


Many parents, however, would take exception to the notion of sending their kids to school during a pandemic.  Not only would it, in their estimation - endanger their children – it increases the odds of them bringing the virus home to the rest of the family as well.


So it is important to get some approximation of the benefits that school closings would generate.  To that end we’ve seen several studies over the past year that have produced varying estimates.


Study: Student Behavior During Pandemic School Closings
School Closures Revisited
Study: Effect Of School Closures On Viral Transmission


Today we’ve another study appearing in BMC Infectious Diseases, this time from the School of Computer Science and Software Engineering at the the University of Western Australia.


Here is the abstract (slightly reformatted for readability).


Developing guidelines for school closure interventions to be used during a future influenza pandemic

Nilimesh Halder , Joel K Kelso  and George J Milne

BMC Infectious Diseases 2010, 10:221doi:10.1186/1471-2334-10-221

Published: 27 July 2010

Abstract (provisional)
Background

The A/H1N1 2009 influenza pandemic revealed that operational issues of school closure interventions, such as when school closure should be initiated (activation trigger), how long schools should be closed (duration) and what type of school closure should be adopted, varied greatly between and within countries. Computer simulation can be used to examine school closure intervention strategies in order to inform public health authorities as they refine school closure guidelines in the light of experience with A/H1N1 2009 pandemic.

Methods

An individual-based simulation model was used to investigate the effectiveness of school closure interventions for influenza pandemics with R0 of 1.5, 2.0 and 2.5. The effectiveness of individual school closure and simultaneous school closure were analyzed for 2, 4 and 8 weeks closure duration with a daily diagnosed case based intervention activation trigger scheme. The effectiveness of combining antiviral drugs with school closure was also investigated.

Results

Attack rate was reduced from 33% to 19% (14% reduction in overall attack rate) by 8 weeks school closure activating at 30 daily diagnosed cases in a community for an influenza pandemic with R0 = 1.5; whereas combined with antivirals, 19% (from 33% to 14%) reduction in attack rate was obtained.


For R0 >= 2.0, school closure would be less effective. An 8 weeks school closure strategy gives 9% (from 50% to 41%) and 4% (from 59% to 55%) reduction in attack rate for R0 = 2.0 and 2.5 respectively; however, school closure plus antivirals would give a significant reduction (~15%) in over all attack rate. The results also suggest that an individual school closure strategy would be more effective than simultaneous school closure.

Conclusions

Our results indicate that the particular school closure strategy to be adopted depends both on the disease severity, which will determine the duration of school closure deemed acceptable, and its transmissibility.


For epidemics with a low transmissibility (R0 < 2.0) and/or mild severity, individual school closures should begin once a daily community case count is exceeded. For a severe, highly transmissible epidemic (R0 >= 2.0), long duration school closure should begin as soon as possible and be combined with other interventions.


George E. P. Box, Professor Emeritus of Statistics at the University of Wisconsin, is often credited with coining the familiar adage:


“All models are wrong, but some models are useful.”


While imperfect, we use computer models every day to try to mathematically simulate real-life events;  everything from highway traffic flow to weather forecasting.


The authors describe some of the limitations to their study, including:


As the model is based on a population in a developed country the outcomes may not be applicable to populations in a developing country, where populations may be less mobile and have higher population densities.


We have focused on the reduction in the number of daily symptomatic cases and the cumulative illness attack rate as they are used for determining intervention effectiveness rather than focusing on influenza-related adverse events such as hospitalizations and deaths.


We also do not take account of possible antiviral drug resistance [40] [41] that may arise due to the implementation of antiviral drug strategies, as our main goal is to suggest refinements to policy guidelines for school closure.


In this case, the authors based their modeling on a medium sized (pop. 30,000) town in Western Australia. 


They find a substantial reduction in the spread of a future pandemic influenza can be achieved by the (extended) closing of schools at the optimum point in the local spread of the virus.


Gauging when and how long to close schools, however, may require information that isn’t always immediately available.  Such as the R0 (basic reproductive number) of the virus, the CFR (Case Fatality Ratio) or, the number of people actually infected in a community. 


Despite the fact that life is messy, and computer models aren’t perfect at depicting it, the entire report is worth reading.


This is how the authors sum up their study.


Conclusions 


Our simulation results give guidance as to public health policy decisions in the refinement of school closure strategies to be used in a future influenza pandemic. We have systematically evaluated school closure operational issues to determine when schools should be closed and re-opened to achieve the maximum reduction in influenza spread.


We found that the optimal timing of school closure depends both on the duration of school closure (which we assume will depend on the severity of the influenza strain, with strains that are more severe in terms of serious infection outcomes making longer periods of school closure acceptable) and on the transmissibility of the influenza strain (which influences the rate of growth and spread of the epidemic).


Accurate early estimates of epidemic characteristics such as the basic reproduction number and disease severity are thus necessary to achieve the maximum case reduction from school closure.


We found that a policy of allowing schools to close individually was much less sensitive to the precise timing of the intervention than a policy of simultaneous community-wide school closure, a valuable observation given the difficulty in determining the true degree of epidemic spread in the early stages of an outbreak.

»» Read More

Haiti: Worries Over Epidemic Risks


# 4208


Although there is absolutely never a good time for any city to endure a 7.0 earthquake, Port-au-Prince, Haiti had the small bit of luck to see their disaster come during their dry season.  


Temperatures and humidity's are at their lows for the year, and hurricane season is still six months away.


image


The rainy season is coming, however.  And that will only add to the misery – and the potential for disease – in the refugee camps. 


Already health care workers are reporting cases of measles, diarrhea, and tetanus in the recovery area.  With sanitation problems, difficulties in getting clean drinking water, and the close quarters people now find themselves living in – the potential for further outbreaks is increasing.


This from the VOA News.


WHO: Risk of Epidemics in Haiti Increasing

World Health Organization says people are at great risk of getting diarrhea, cholera and other water borne diseases because of the bad sanitary conditions and contaminated water.


Lisa Schlein | Geneva 30 January 2010

A camp of makeshift tents sprawls at Port-au-Prince's golf course, where many Haitians displaced by the earthquake have set up shelter, 25 Jan 2010

Photo: UN//Marco Dormino

A camp of makeshift tents sprawls at Port-au-Prince's golf course, where many Haitians displaced by the earthquake have set up shelter, 25 Jan 2010

The World Health Organization says the risk of epidemics breaking out in earthquake-devastated Haiti is increasing as the rainy season approaches.  WHO says it already is receiving reports of a growing number of cases of diarrhea, measles and tetanus.


The World Health Organization says it is worried about an explosion of diseases in Haiti.  It says people are at great risk of getting diarrhea, cholera and other water borne diseases because of the bad sanitary conditions and contaminated water.


It says contagious diseases such as measles can spread like wildfire in the overcrowded, squalid resettlement camps.


WHO spokesman Paul Garwood says U.N. agencies and the Haitian government will conduct a campaign next week to immunize hundreds of thousands of children under age five against measles, tetanus and diphtheria.


He says WHO and other aid agencies will be taking additional measures to try to prevent epidemics from breaking out.


(Continue . . .)

»» Read More