Showing posts with label North America. Show all posts

North American Flu Surveillance: Week 7


# 5340


Influenza activity in the United States remains elevated, while in Canada – where levels had been declining for several weeks -  the number of new influenza cases is on the rise again.


A few excerpts from week 7’s data (ending Feb 19th) -pulled from the latest CDC’s FluView and PHAC’s  FluWatch  surveillance reports.


In Canada:


Summary of FluWatch Findings for the Week ending February 19, 2011

  • In week 07, there was an increase in overall influenza activity level, with 62.5% (35/56) of regions reporting localized influenza activity. There was a substantial increase in the number of outbreaks reported this week. The proportion of positive influenza detections overall decreased slightly, though the ILI consultation rate remained similar to the previous week.
  • Since the beginning of the season, 86.3% of the subtyped positive influenza A specimens have been influenza A/H3N2. In week 07, pandemic H1N1 2009 detections increased to 8% of positive influenza detections while the proportion of influenza B detections remained stable at 10%.

image

Overall Influenza Summary – Week 7 (February 13 to February 19, 2011)

In week 07, 35 regions reported localized activity (in all provinces except PE), 15 regions reported sporadic activity (in all provinces and territories except YK) and 6 regions presented no activity (see Activity level Map).

Compared to the previous week (week 06), 15 regions reported an increased level of influenza activity, 5 regions reported decreased activity, and 33 regions maintained a stable level of influenza activity (sporadic or higher).

Fifty-one new ILI/influenza outbreaks were reported: 26 in long-term care facilities (LTCF) in BC(2), SK (5), ON(4), QC(7), NB (2) and NS(6); 20 school outbreaks in AB(2), NB(15), NS(1) and NL(2); 1 hospital outbreak in ON; and 4 outbreaks in other facilities in SK(1), ON(2) and NL(1).


From the CDC, a few excerpts from this week’s FluView report.


2010-2011 Influenza Season Week 7 ending February 19, 2011

image

Synopsis

During week 7 (February 13-19, 2011), influenza activity in the United States remained elevated.

  • Of the 9,154 specimens tested by U.S. World Health Organization (WHO) and National Respiratory and Enteric Virus Surveillance System (NREVSS) collaborating laboratories and reported to CDC/Influenza Division, 2,866 (31.3%) were positive for influenza.
  • The proportion of deaths attributed to pneumonia and influenza (P&I) was above the epidemic threshold for the fourth consecutive week.
  • Six influenza-associated pediatric deaths were reported bringing to season total to 41. Three of these deaths were associated with an influenza B virus, one was associated with an influenza A (H3) virus, one was associated with a 2009 influenza A (H1N1) virus, and one was associated with an influenza A virus for which the subtype was not determined.
  • The proportion of outpatient visits for influenza-like illness (ILI) was 4.9%, which is above the national baseline of 2.5%. All 10 regions reported ILI above region-specific baseline levels. Twenty-one states experienced high ILI activity; six states experienced moderate ILI activity; New York City and 16 states experienced low ILI activity; seven states experienced minimal ILI activity, and the District of Columbia had insufficient data.
  • The geographic spread of influenza in 44 states was reported as widespread; four states reported regional influenza activity; the District of Columbia reported local influenza activity; Puerto Rico, the U.S. Virgin Islands, and two states reported sporadic influenza activity, and Guam reported no influenza activity.

U.S. Virologic Surveillance:

WHO and NREVSS collaborating laboratories located in all 50 states and Washington D.C. report to CDC the number of respiratory specimens tested for influenza and the number positive by influenza type and subtype. The results of tests performed during the current week are summarized in the table below.

image

Pneumonia and Influenza (P&I) Mortality Surveillance

During week 7, 8.3% of all deaths reported through the 122-Cities Mortality Reporting System were due to P&I. This percentage was above the epidemic threshold of 8.0% for week 7 and is the fourth consecutive week in which P&I has been above the epidemic threshold.

Pneumonia And Influenza Mortality

Influenza-Associated Pediatric Mortality

Six influenza-associated pediatric deaths were reported to CDC during week 7. Three of these deaths were associated with an influenza B virus, one was associated with an influenza A (H3) virus, one was associated with a 2009 influenza A (H1N1) virus, and one was associated with an influenza A virus for which the subtype was not determined. Forty-one deaths from 21 states (Arizona, Colorado, Florida, Georgia, Illinois, Indiana, Louisiana, Michigan, Nevada, New Jersey, New Mexico, New York, North Carolina, North Dakota, Oklahoma, Pennsylvania, Texas, Utah, Virginia, West Virginia, and Wisconsin) and New York City have been reported during this influenza season.

Sixteen of the 41 deaths reported were associated with influenza B viruses, 10 deaths reported were associated with influenza A (H3) viruses, eight were associated with 2009 influenza A (H1N1) viruses, and seven were associated with an influenza A virus for which the subtype was not determined.

Influenza-Associated Pediatric Mortality

»» Read More

North America Influenza Surveillance - Week 4


# 5290


While the flu season appears to have peaked in Canada, the numbers in the United States continue to climb in the latest surveillance reports.


We’ve also fresh report in this week’s MMWR and CDC FluView  on another novel H3N2 swine flu virus detection in Pennsylvania dating back to last September.


As you will recall, last year the US saw 4 other cases, and last month China reported a case as well (see China: Single Novel Swine Flu Infection Reported).


First some details on this latest novel virus detection, then a brief look at the latest surveillance numbers from Canada and the United States.


The following comes from this week’s FluView report. I’ve bolded some of the highlights.


Novel Influenza A Virus:

One case of human infection with a novel influenza A virus was reported by the Pennsylvania Department of Health. The patient was infected with a swine origin influenza A (H3N2) virus. The patient reported contact with pigs in the week preceding symptom onset on September 6, 2010, did not require hospitalization, and has since fully recovered.

Initial testing of the specimen indicated a seasonal influenza A (H3N2) virus and the specimen was submitted to CDC as a routine surveillance sample. The delay from onset to detection occurred because attempts to culture the virus were unsuccessful. RT-PCR testing confirmed swine-origin influenza A (H3N2). Six other human infections with swine origin influenza A (H3N2) viruses have been identified in the United States during 2009 through 2010, including one other case from Pennsylvania in week 44 of 2010.


No epidemiologic links between this case and any of the other cases of swine-origin H3N2 infection have been identified and the viruses from all seven cases have genetic differences indicating different sources of infection.


There is no evidence of human-to-human transmission with this virus; however, early identification and investigation of all human infections with novel influenza A viruses is critical to evaluate the extent of the outbreak and possible human-to-human transmission. Surveillance for human infections with novel influenza A viruses continues year round.


For more on the potential threats posed by novel swine viruses, you wish to revisit my recent blog The (Swine) Influenza Reassortment Puzzle.


Moving on to Canada’s FluWatch report:


Summary of FluWatch Findings for the Week ending January 29, 2011

  • Overall influenza detections appear to have peaked, with most regions across the country continuing to show a decline in the percentage of positive influenza detections, with the exception of the Atlantic provinces. Other indicators of influenza activity have either decreased or remained similar to the previous week.
  • Since the beginning of the season, 88.9% of the subtyped positive influenza A specimens were influenza A/H3N2.In week 04, detections of pandemic H1N1 2009 decreased slightly as a proportion of subtyped influenza A specimens, while influenza B virus detections increased slightly. The proportion of positive tests for RSV continued to increase.

  • image


Moving on to the United States FluView report:


010-2011 Influenza Season Week 4 ending January 29, 2011

.

Synopsis:

During week 4 (January 23-29, 2011), influenza activity in the United States increased.

  • Of the 6,209 specimens tested by U.S. World Health Organization (WHO) and National Respiratory and Enteric Virus Surveillance System (NREVSS) collaborating laboratories and reported to CDC/Influenza Division, 2,044 (32.9%) were positive for influenza.
  • One human infection with a novel influenza A virus was reported.
  • The proportion of deaths attributed to pneumonia and influenza (P&I) was above the epidemic threshold.
  • Six influenza-associated pediatric deaths were reported. Four of these deaths were associated with influenza B viruses, one of these deaths was associated with an influenza A (H3) virus, and one was associated with a 2009 influenza A (H1N1) virus.
  • The proportion of outpatient visits for influenza-like illness (ILI) was 4.0%, which is above the national baseline of 2.5%. Seven of the 10 regions (Regions 1, 2, 3, 4, 5, 6, and 7) reported ILI at or above region-specific baseline levels. Seventeen states experienced high ILI activity; three states experienced
  • moderate ILI activity; New York City and 10 states experienced low ILI activity; the District of Columbia and 19 states experienced minimal ILI activity, and one state had insufficient data.
  • The geographic spread of influenza in 30 states was reported as widespread; 15 states reported regional influenza activity; the District of Columbia and one state reported local influenza activity; Puerto Rico, the U.S. Virgin Islands, and four states reported sporadic influenza activity, and Guam reported no influenza activity.

image

image

Pneumonia and Influenza (P&I) Mortality Surveillance

During week 4, 8.5% of all deaths reported through the 122-Cities Mortality Reporting System were due to P&I. This percentage was above the epidemic threshold of 7.9% for week 4.

image

Outpatient Illness Surveillance:

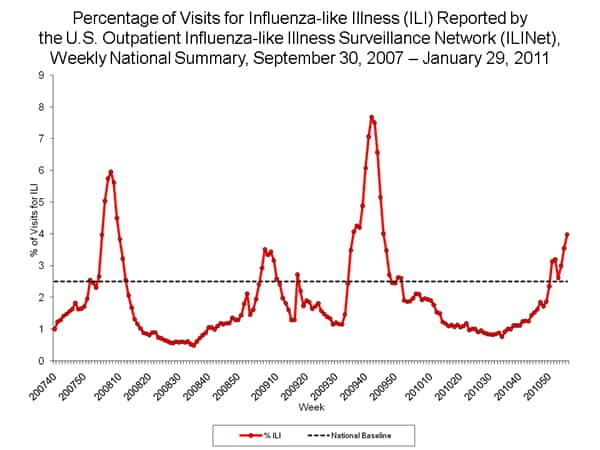
Nationwide during week 4, 4.0% of patient visits reported through the U.S. Outpatient Influenza-like Illness Surveillance Network (ILINet) were due to influenza-like illness (ILI). This percentage is above the national baseline of 2.5%.

national levels of ILI and ARI

»» Read More

North America: Flu Surveillance Week 3


# 5266


The weekly surveillance numbers from Canada and the United States were released yesterday and some interesting trends are beginning to emerge.


In Canada, the peak of the flu season may have been reached, although some indicators are up while others are down – while in the United States influenza activity is picking up pretty much across the board.


Interestingly, while the H3N2 virus remains the dominant influenza A strain detected in the United States, after several months of low activity, levels of H1N1 have risen 3 weeks in a row.


We’ll start with Canada’s weekly FluWatch report.


January 16 to January 22, 2011 (Week 03)

Summary of FluWatch Findings for the Week ending January 22, 2011

  • Overall influenza detections appear to have peaked, with most regions across the country now showing a decline in the percentage of positive influenza detections, except BC and the Atlantic provinces. Paediatric and adult hospitalizations have decreased this week, however, some indicators have increased including the number of regions reporting widespread and localized influenza/ILI activity, the number of outbreaks, and the ILI consultation rate.  
  • Since the beginning of the season, 89.5% of the subtyped positive influenza A specimens were influenza A/H3N2.In week 03, detections of pandemic H1N1 2009 increased slightly to 16.9% of all subtyped influenza A specimens, compared to 15.5% in week 02. The overall proportion of positive tests for RSV has increased from 9.6% to 12.5% in week 03.

image

image

Percent positive influenza tests, compared to other respiratory viruses, Canada, by reporting week, 2010-2011

Percent positive influenza tests, compared to other respiratory viruses, Canada, 
by reporting week, 2010-2011


Moving south, the CDC’s  FluView system paints a picture of a flu season still gaining speed.  While it varies from year-to-year, February is usually the the height of the influenza season in the United States.


2010-2011 Influenza Season Week 3 ending January 22, 2011

All data are preliminary and may change as more reports are received.

Synopsis:

During week 3 (January 16-22, 2011), influenza activity in the United States increased.

  • Of the 5,823 specimens tested by U.S. World Health Organization (WHO) and National Respiratory and Enteric Virus Surveillance System (NREVSS) collaborating laboratories and reported to CDC/Influenza Division, 1,754 (30.1%) were positive for influenza.
  • The proportion of deaths attributed to pneumonia and influenza (P&I) was below the epidemic threshold.
  • Three influenza-associated pediatric deaths were reported. Two of these deaths were associated with influenza A (H3) virus infection and one was associated with an influenza B virus.
  • The proportion of outpatient visits for influenza-like illness (ILI) was 3.6%, which is above the national baseline of 2.5%. Six of the 10 regions (Regions 2, 3, 4, 5, 6, and 7) reported ILI above region-specific baseline levels. Nine states experienced high ILI activity, eight states experienced moderate ILI activity, New York City and nine states experienced low ILI activity, 24 states experienced minimal ILI activity, and data were insufficient from the District of Columbia.
  • The geographic spread of influenza in 25 states was reported as widespread; 16 states reported regional influenza activity; the District of Columbia and four states reported local influenza activity, Puerto Rico, the U.S. Virgin Islands, and four states reported sporadic influenza activity, Guam reported no influenza activity, and one state did not report.

U.S. Virologic Surveillance:

WHO and NREVSS collaborating laboratories located in all 50 states and Washington D.C. report to CDC the number of respiratory specimens tested for influenza and the number positive by influenza type and subtype. The results of tests performed during the current week are summarized in the table below.

All 50 states and the District of Columbia have reported laboratory-confirmed influenza this season.

image

INFLUENZA Virus Isolated

Pneumonia and Influenza (P&I) Mortality Surveillance

During week 3, 7.5% of all deaths reported through the 122-Cities Mortality Reporting System were due to P&I. This percentage was below the epidemic threshold of 7.9% for week 3.

Pneumonia And Influenza Mortality

image

(click for interactive map)


For more on all of this, Lisa Schnirring at CIDRAP news has an excellent summary of this week’s flu reports.


US flu picking up pace; global activity mixed

»» Read More